Frequency selective digital filters
Importance and application of digital filters on sampled signals
table of contents
1.1 The real-time concept of the Goldammer measurement cards
1.2 The sampling theorem or rules for sampling time signals
1.6 Recursive filters (IIR filters)
1.7 Non-recursive filters (FIR filters)
- 1.7.1 Entwurfsverfahren
- 1.7.2 Fenster-Methode
- 1.7.3 Frequenzabtastung
- 1.7.4 Remez-Methode
- 1.7.5 Window function
1.8 Comparison of IIR and FIR filters
1.9 Settings for digital filters in DIAdem
1 Digitale Filter
1 digital filter
1.1 The real-time concept of the Goldammer measurement cards
The intelligent measurement cards of the MC4-PCI series from Goldammer relieve the PC when it comes to recording and outputting signals. This includes real-time processing of acquired signals. This real-time processing is integrated in our drivers and is therefore very easy to activate and configure. Each channel is treated individually.
Acquired signals can be digitally filtered in real time on the map. Filtering may be necessary, for example to isolate the measurement signal from interfering signals. For this purpose, the sampled values are fed to a filter algorithm immediately after the conversion. The required coefficients are determined using a program library that is integrated in our drivers for the most common measurement acquisition systems such as DIAdem, Dasylab and Labview and therefore does not require any additional programs. The user only needs to specify the conditions for the filter design. All further work is automatically taken over and carried out by our drivers.
1.2 The sampling theorem or rules for sampling time signals
There are some requirements for the sampling and processing of sampled signals with digital systems. These are:
- The signal must be band-limited, ie all frequency components must be zero above a limit frequency.
- The sampling frequency must be at least twice as high as the limit frequency of the signal
These rules are called “SHANNON’s sampling theorem”. If it is not adhered to, ie the sampling rate is not at least twice as large as the limit frequency of a signal, frequency components occur in the spectrum that are actually not contained in the signal. This effect is called “aliasing” and results from the reflection of frequencies above the cutoff frequency into the area below the cutoff frequency. The cutoff frequency is called the “Nyquist frequency”.
1.3 How digital filters work
Sampled signals are generally a mixture of a useful signal (which contains information) and interfering signals. The interference signals can be signals with a different frequency or noise that is superimposed on the useful signal.
In most cases, the interfering signals are of significantly smaller amplitude than the useful signal and therefore do not need to be taken into account. If this is not the case, the useful signal can be covered by the interference component and the information in the useful signal cannot be evaluated.
If the interfering components can be removed from the sampled signal using a suitable method, the information from the useful signal is available again. Selective filters are often used here. These filters make use of the fact that the interference components generally have a different frequency than the useful signal. They select the frequencies of the useful signal from the sampled signal and suppress all other frequency components.
The filtering of a signal sometimes requires a lot of computing time. In order to relieve the PC of filtering the sampled signal, the sampled signal can be filtered immediately on cards from Goldammer and the filtered signal can be transferred to the PC.
The last sub-chapter shows performance measurements. They show the possible number of coefficients of FIR filters depending on the number of channels and the total sampling rate.
1.4 Filter types
There are four standard types of selective filters:
Low- pass high frequencies are suppressed, low frequencies are retained
High- pass low frequencies are suppressed, high frequencies are retained
Bandpass
frequencies within a range are retained, outside they are suppressed
Band stop
frequencies within a range are suppressed, outside they are retained
There are also multiband filters that have several pass and stop ranges and other types of filters that are not discussed further here.
Which filter type is to be used and how the pass and stop bands are distributed over the frequency response is determined by coefficients and is therefore independent of the calculation algorithm. However, the coefficients have to be determined in different ways for each filter algorithm and cannot be directly transferred to other algorithms. Filter algorithms are also known as filter structures
The most common structures for digital filters are recursive (IIR) and non-recursive (FIR) filters. Both are supported by Goldammer measuring cards.
1.5 The tolerance scheme
The tolerance scheme is the basis of the filter design. All information required for the filter design is entered in this scheme.
The necessary parameters are:
Cut-off frequencies You define the width of the transition area from the pass band to the stop band
. The number varies depending on the filter type.
A pair of cut-off frequencies is required for each filter edge.
It follows from this: low and high passes need 2 cut-off frequencies, band-passes and bandstop filters need 4 cut-off frequencies.
Blocking attenuation Frequencies in the blocking range should be attenuated by at least this value.
Pass- through attenuation Frequencies in the pass- band may be attenuated by this value
at most.
Sometimes allowable ripples are given. The permissible ripples can be converted into attenuation and vice versa.
The width of the transition area and the specified attenuation determine the filter order. The narrower the transition area and the higher the blocking attenuation, the greater the filter order required and thus the computational effort of the filter.
The tolerance scheme can be represented in several ways. In most cases the attenuation is given.
Figure 1.2 shows such a tolerance scheme in which the attenuations are specified. In
Figure 1.1 shows the permissible ripples. In order to meet the tolerance scheme, the frequency response of the filter must not cross the hatched areas. In that case the tolerance scheme would be violated. In order to reduce the filter order, it can be decided on a case-by-case basis whether a slight violation of the tolerance scheme is permissible.
Tolerance scheme of a low pass with:
Sampling frequency: 1000 Hz
lower limit frequency: 100 Hz
upper limit frequency: 200 Hz
permissible ripple in the pass band: d d
permissible ripple in the blocking range: d s
 |
| Picture 1 . 1 : Tolerance scheme with details of the frequencies and permissible ripples |
Instead of the ripples, the attenuation is given in the following tolerance scheme. The following also applies here: the hatched areas must not be traversed by the frequency response of the filter.

Picture 1 . 2 : Tolerance scheme with details of the frequencies and attenuations
1.6 Recursive filters (IIR filters)
Recursive filters are filters in which the output signal of the filter is fed back to the filter input. The name comes from English and means “infinite i mpuls r esponse” (infinite impulse response). The required filter order can be reduced by the feedback. However, the generally non-linear phase has a disadvantageous effect.
The design of IIR filters can be traced back to the design of analog filters. In this way, among other things, the order can be determined which is required to meet the tolerance scheme. Likewise, the design of a high-pass filter can be traced back to the design of a low-pass filter by means of a transformation. So only a low pass needs to be determined. Other filter types (low-pass, high-pass, band-pass, band-stop) can be calculated from this low-pass prototype using so-called frequency transformations. It is not necessary to limit the coefficients. This is a great advantage over FIR filters.
1.6.2 Chebycheff 1
Straight-line frequency response only in the stop band and ripple in the pass band, thus only full utilization of the tolerance scheme in the pass band. Due to better utilization of the tolerance scheme, the degree of filtering is smaller than with Butterworth filters. The group delays change slightly over the frequency response.
1.7 Non-recursive filters (FIR filters)
Non-recursive filters are filters in which the output signal of the filter is not fed back to the filter input. The name comes from English and means ” f inite i mpuls r esponse” (finite impulse response). These types of filters are always stable. With them it is possible to realize a linear phase and thus a constant group delay without additional effort. This advantage over the IIR filters is bought at the price of a higher filter order.
The design of FIR filters cannot be traced back to the design of analog filters. Likewise, the order that is required to meet the tolerance scheme cannot be determined. This leads to a try-and-fail approach in which the design process is performed recursively. With each pass, the order is increased and it is checked whether the tolerance scheme is met. If it is fulfilled, the recursion is canceled. There are also no known transformations that can be used to convert a low-pass filter into a different type of filter, such as a high-pass filter. Every design problem has to be solved anew.
1.7.1 Design process
The driver for the cards from Goldammer support several design methods for calculating coefficients for FIR filters. Any design process can
Calculate low-pass, high-pass, band-pass and band-stop filters.
Since the order of an FIR filter cannot be calculated absolutely, an additional function is implemented that uses the tolerance scheme to determine the order with which the tolerance scheme is fulfilled. However, this can take some time, as the design process is repeated recursively until the correct order has been found.
1.7.2 Window method
With the window method, an impulse response is calculated. For this purpose, functions are used with which the coefficients can be calculated directly. However, only a linear phase can be achieved in this way.
The length of the calculated impulse response is limited. If the impulse response is cut off, one speaks of a limitation with a rectangular window. This leads to overshoots on the filter flanks. These overshoots decrease as the distance to the flank increases. Increasing the order does not reduce the overshoot amplitudes. By using a different window function that does not cut off the impulse response, but rather attenuates the coefficients at the edges more and more towards zero. In this way, the overshoots are greatly reduced. This is paid for by a less steep slope. The function courses of some window functions are shown in ( 1.7.5 ).
The following figures show the frequency responses of filters with different orders. It can be seen that the overshoots do not disappear when the order is increased, but that they are only concentrated in a smaller area around the flank. The Hanning window reduces the overshoot clear, but the flank is less steep.

Picture 1 . 3 : Frequency response of a 20th order filter designed with the window method. The waviness can be clearly seen by using the rectangular window. The Hanning window reduces the ripple, but reduces the slope.

Picture 1 . 4 : Frequency response of a 60th order filter designed according to the window method. The flank became steeper, but the waviness did not decrease.
1.7.3 Frequenzabtastung
The frequency sampling generates an impulse response from a frequency and a phase response with the help of the inverse FFT. The advantage here is that any frequency and phase responses can be implemented. The computational effort is mainly determined by the FFT. The filter order plays a subordinate role.
The coefficients calculated here are only an approximation of the real impulse response. The accuracy can be increased by increasing the FFT points. This increases the computing time required, however.
The problem of overshoots at the filter flanks also occurs here. By using window functions, these overshoots can be reduced at the expense of a less steep slope.
1.7.4 Remez-Methode
The Remez method generates filter coefficients known as “equi-ripple-filters”. Another term is “optimal FIR filter”. The filters designed according to this method are optimal in that they optimally fill the tolerance scheme in the passage and blocking area. This creates a uniform ripple in both the pass band and the blocked area (similar to the Chebyshev3 IIR filter). Furthermore, these filters often require a lower order to meet the tolerance scheme than the design methods mentioned above.
A disadvantage is the high computational effort. In return, this design method offers great flexibility.

Picture 1 . 5 : Frequency response of a 20th order filter designed using the Remez method.

Picture 1 . 6 : Frequency response of a 60th order filter designed with the Remez method.
A window function is not necessary with the Remez method. The waviness becomes smaller with increasing order.
1.7.5 Window function
This design method only creates a window function and transfers it to the calling routine.
The number of coefficients of the window function is the transferred order plus one.
Over 200 window functions are known. The most frequently used window functions are offered by our driver.
Various window functions are shown in the picture below.

Picture 1 . 7 : Functional history of some window functions
1.8 Comparison of IIR and FIR filters
A direct comparison between IIR and FIR filters is not possible. Depending on the task and the boundary conditions, the user must decide which type of filter should be used.
To do this, the advantages and disadvantages of the two types of filter must be weighed against each other.
The following table is intended to help:
| FIR Filter | IIR filter | ||
| advantages | disadvantage | advantages | disadvantage |
| always stable | not always stable, therefore check stability | ||
| constant (linear) group delay | variable (non-linear) group delay | ||
| The output signal is not falsified | The output signal is falsified | ||
| finite impulse response, thus overshoots at jump points | Infinite impulse response, therefore no overshoots at jump points | ||
| higher order necessary to fulfill the tolerance scheme than with IIR | lower order necessary to fulfill the tolerance scheme than FIR | ||
| large group delays and high computational effort | smaller group delays and lower computational effort | ||
1.9 Settings for digital filters in DIAdem

Picture 1 . 8 : Input mask for filters under DIAdem
To activate and configure filters, click on “Device ..”. The various setting options are listed at the top of the dialog that opens.
- The inputs are configured on this page.
- Here are the settings for the filter of a channel, which can be selected under (3). The settings on this page can be set individually for each channel.
- Here you can select a channel that you want to configure. If the selected channel is configured, the next channel can be selected here.
- At this point you can specify for the channel selected under (3) whether the sampled values of this channel should be subjected to a filter.
- Selection of filter structures (recursive IIR or non-recursive FIR filters). The filter structure selected here influences the meaning and entries of other input fields.
- Definition of the filter type. Possible settings: low pass, high pass, band pass, band stop
- Limit frequencies of the 1st filter edge, left the lower, right the upper limit frequency of the edge.
The specification of this edge is required for low pass and high pass. With these types, the 2nd flank is ignored. - Limit frequencies of the 2nd filter edge, left the lower, right the upper limit frequency of the edge.
This edge is also required for bandpass and bandstop. - Frequencies can be specified as absolute (in Hz) or standardized. Normalized frequencies have the advantage that the sampling frequency does not have to be taken into account. Absolute frequencies can be converted into normalized frequencies if the sampling rate is known and given. With the “absolute frequencies” setting, the sampling frequency is taken from the clock block during initialization.
- The attenuation in the pass-through and blocked areas are specified here.
On the left the transmission attenuation, on the right the blocking attenuation. The blocking attenuation should always be greater than the transmission attenuation. - Attenuation can also be specified as an indication of permissible ripples. A conversion is carried out internally. Here it is specified whether the input is to be interpreted as damping or as waviness.
- The design process is specified here. At this point, a distinction must be made between which filter structure was selected under (5). Advantages, disadvantages and peculiarities of the design method are explained above.
FIR filter window method, frequency scanning, Remez method, window function
IIR filter Butterworth, Tschebyscheff 1, Tschebyscheff 2, Cauer - This field is used to select the window function with which the coefficients are to be evaluated in order to minimize the ripples in the filter edges.
This selection is only available for FIR filters. - A click on this field opens a window in which the frequency response and the group delay of the filter are displayed. In this way, the user can get a visual overview of the behavior of the filter he has defined.
- Once the parameters have been set for all channels, the configuration window can be closed.
1.10 Settings for digital filters under Dasylab
Digital filters are only supported under Dasylab with the Extension Toolkit.

Picture 1 . 9 : Input mask for filters under Dasylab
You open this dialog box by clicking on the “Filter Settings” field in the configuration dialog for the selected block.
- At this point you can specify for the selected channel whether the sampled values of this channel should be subjected to a filter.
- Selection of filter structures (recursive IIR or non-recursive FIR filters). The filter structure selected here influences the meaning and entries of other input fields.
- Definition of the filter type. Possible settings: low pass, high pass, band pass, band stop
- Frequencies can be specified as absolute (in Hz) or standardized. Normalized frequencies have the advantage that the sampling frequency does not have to be taken into account. Absolute frequencies can be converted into normalized frequencies if the sampling rate is known and given. The limit frequencies of the 1st and 2nd filter edge are also entered here.
The lower limit frequency of the edge is defined on the left and the upper limit frequency on the right.
Low passes and high passes only require the 1st filter edge, the 2nd edge is ignored. ‘
Bandpasses and bandstop filters also require the specification of the 2nd filter edge. - Attenuation can also be specified as an indication of permissible ripples. A conversion is carried out internally. Here it is specified whether the input is to be interpreted as damping or as waviness. The attenuation in the pass-through and blocked areas are also specified here. The blocking attenuation should always be greater than the transmission attenuation.
- The design process is specified here. At this point, a distinction must be made between which filter structure was selected under (5). Advantages, disadvantages and peculiarities of the design method are explained above.
FIR filter window method, frequency scanning, Remez method, window function
IIR filter Butterworth, Tschebyscheff 1, Tschebyscheff 2, Cauer - This field is used to select the window function with which the coefficients are to be evaluated in order to minimize the ripples in the filter edges.
This selection is only available for FIR filters. - A click on this field opens a window in which the frequency response and the group delay of the filter are displayed. In this way, the user can get a visual overview of the behavior of the filter he has defined.
- Once all parameters have been set, the configuration window can be closed.
1.11 Performance data
The performance measurements were carried out with the following measuring system:
PC:
Processor: AMD K6-200
Speicher: 128MB PC-100 (DIMM)
Mainboard: Asus P5A B
Chipset: ALI
Graphics card: Diamond Viper AGP (RIVA 128)
Meß-Software:
DIAdem 7.02
Measurement in the hardware cycle
Display by graph
DLL-Version: 5.2.0.0
DSP driver: 5.2.1.1
Measurement card:
MC4Light / HS from Goldammer
 1.11.1 FIR-Filter
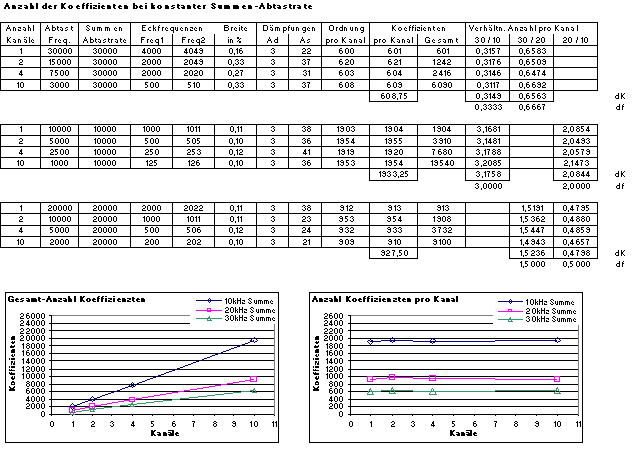
Some conclusions can be drawn from this data:
1) With a constant total sampling rate, the number of coefficients per channel remains almost constant.
2) Changing the total sampling rate by a factor of a increases the number of coefficients per channel by a factor of 1 / a.
3) The total number of coefficients increases almost linearly with the number of channels.
4) The change in the number of coefficients per channel is real 1 / (a - 1.5% .. 5%). Reducing the sampling rate increases the number of possible coefficients per channel by a factor that allows approx. 1.5% .. 5% more coefficients.